Thermodynamic Steam Tables
Thermodynamics Directory | Heat Transfer Directory
Related Resources:
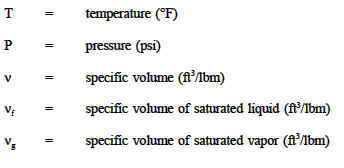
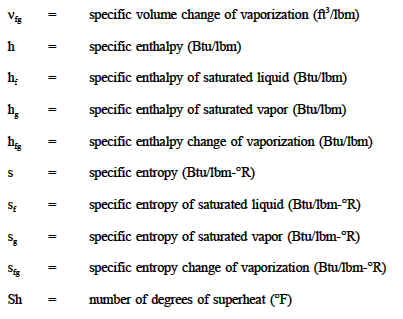
Steam tables consist of two sets of tables of the energy transfer properties of water and steam saturated steam tables and superheated steam tables. Portions of the tables are shown in Figure A-2. Both sets of tables are tabulations of pressure (P), temperature (T), specific volume (n), specific enthalpy (h), and specific entropy (s). The following notation is used in steam tables. Some tables use v for n (specific volume) because there is little possibility of confusing it with velocity.
In order to solve problems in Thermodynamics,information concerning the "state" of the substance studied must be obtained. Usually,two properties (for example, v, p, T, h, s) of the substance must be known in order to determinethe other needed properties. These other properties are usually obtained utilizingeither the Mollier diagram (if the substance is steam) or the saturated and superheated steam tables,as shown in the Figures A-1 and A-2.
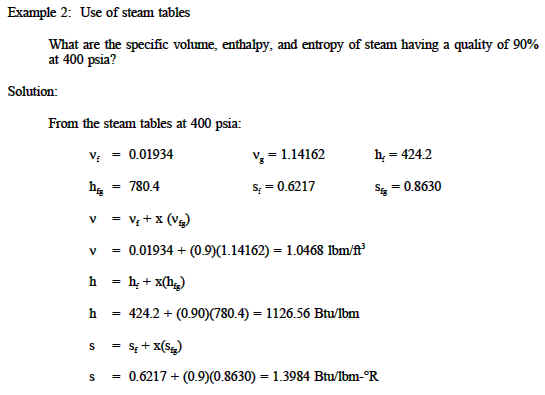
The following two examples illustrate the useof the Mollier diagram and the steam tables.
Example 1: Use of Mollier Chart. Superheated steam at 700 psia and 680F is expanded at constant entropyto 140 psia.
What is thechange in enthalpy?
Solution:
Use the Mollier Chart. Locate point 1 at theintersection of the 700 psia and the 680F
line. Read h = 1333 Btu/lbm.
Follow the entropy line downward verticallyto the 140 psia line and read h = 1178
Btu/lbm.
h = 1178 - 1333 = -155 Btu/lbm
If the substance is not water vapor, the "state" of the substance is usually obtained through the use of T-s (temperature-entropy) and h-s (enthalpy-entropy) diagrams, available in most thermodynamics texts for common substances. The use of such diagrams is demonstrated by the followingtwo examples.
Example 3: Use of the h-s diagram Mercury is used in a nuclear facility. What is the enthalpy of the mercury if its pressure is100 psia and its quality is 70%?
Solution:
From the mercury diagram, Figure A-3 of Appendix A, locate the pressure of 100 psia. Follow that line until reaching a quality of 70%. The intersection of the two lines gives anenthalpy that is equal to h = 115 Btu/lbm.
Example 4: Use of the T-s diagram
Carbon dioxide is used in a particular process in which the pressure is 100 psia and the temperatureis 100F. What is the enthalpy value of the gas?
Solution:
From the carbon dioxide diagram, Figure A-4 of Appendix A, locate the pressure of 100 psia. Follow that line until reaching a temperature of 100F. The intersection of the two lines gives an enthalpy that is equal to h = 316 Btu/lbm. Once the various states have been fixed for the particular process the substance has passed through (for example, going from a saturated liquid state to a compressed liquid state across a pump), energy exchanges may be determined as was shown in Example 1. The energy exchanges are never 100 percent efficient, as already discussed. The degree of efficiency obtained by the system depends upon the process through which the system has passed. Generally, the efficiency of a component depends upon how much friction exists in the flow of the substance, the pressure drops within the system, the inlet and outlet temperatures, and various other factors. The properties affecting the efficiency of the system are determined by use of the charts and diagrams mentioned in this section. When power cycles are utilized for large systems, the efficiency of each component should be maximized in order to have the highest possible overall efficiency for the system. Each component affects the system efficiency in a different manner. To maximize efficiency, the practical approach to large systems is to have multistage expansion with reheat between stages andregenerators in the system where applicable.
Link to this Webpage:
© Copyright 2000 -
2024, by Engineers Edge, LLC
www.engineersedge.com
All rights reserved
Disclaimer |
Feedback
Advertising
| Contact