Pipe Roughness Coefficients Table Charts
Fluid Flow Table of Contents
Hydraulic and Pneumatic Knowledge
Please note that because of the variation in roughness in these materials depending on the source, the roughness values reported here have uncertainties ranging from ± 20 % for new wrought Iron to ± 70 % for riveted steel. A typical uncertainty in the roughness values can be assumed to be in the range ± − 30 -50 %.
This table lists the roughness Coefficients of Specific roughness, Hazen-Williams Coefficient and Manning Factor.
Pipe Material Roughness Coefficients
|
|||
|---|---|---|---|
Pipe Material
|
Specific Roughness |
Hazen-Williams
Coefficient, C |
Manning Factor, n
|
Steel, welded and seamless
|
0.061 (0.0002)
|
140
|
-
|
Steel, Sheet metal, new
|
5 x 10⁻² (1.6 x 10⁻⁴) |
||
Commercial, new |
4.6 x 10⁻² (1.5 x 10⁻⁴) |
||
Steel, Riveted |
3.0 (1 x 10⁻²) |
||
Steel, Rusted |
2.0 (7 x 10⁻³) |
||
Stainless |
2 x 10⁻³ (7 x 10⁻⁶) |
||
Ductile Iron
|
0.061 (0.0002)
|
130
|
-
|
Iron, Cast new |
2.6 x 10⁻¹ (8.5 x 10⁻⁴) |
||
Iron, Wrough, new |
4.6 x 10⁻² (1.5 x 10⁻⁴) |
||
Iron, Galvanized, new |
1.5 x 10⁻¹ (5 x 10⁻⁴) |
||
Iron, Asphalted, cast |
1.2 x 10⁻¹ (4 x 10⁻⁴) |
||
Ductile Iron, asphalt coated
|
0.12 (0.0004)
|
130
|
0.013
|
Copper and Brass
|
0.61 (0.002)
|
140
|
0.010
|
Brass, new |
2 x 10⁻³ (7 x 10⁻⁶) |
||
Glass
|
0.0015 (0.000005)
|
140
|
-
|
Thermoplastics
|
0.0015 (0.000005)
|
140
|
-
|
Drawn Tubing
|
0.0015 (0.000005)
|
-
|
-
|
Concrete, smoothed |
4 x 10⁻² (1.3 x 10⁻⁴) |
||
Concrete, Rough |
2.0 (7 x 10⁻³) |
||
Rubber, Smoothed |
1 x 10⁻² (3.3 x 10⁻⁵) |
||
Wood, Stave |
5 x 10⁻¹ (1.6 x 10⁻³) |
||
Sources:
Hydraulic Institute, Engineering Data Book. Various vendor data compiled by SAIC, 1998 F.M. White, Fluid Mechanics, 7th edition |
|||
Surface Roughness for Various New Polyethylene Pipes (PE Pipes)
Type of Pipe |
‘ε’ Absolute Roughness of Surface, ft
|
||
Values for
New Pipe Reported by Reference (1) |
Values for New Pipe
and Recommended Design Values Reported by Reference (2) |
||
Mean
Value |
Recommended
Design Value |
||
Riveted steel |
0.03 - 0.003
|
–
|
–
|
Concrete |
0.01 – 0.001
|
–
|
–
|
Wood stave |
0.0003 – 0.0006
|
–
|
–
|
Cast Iron – Uncoated |
0.00085
|
0.00074
|
0.00083
|
Cast Iron – Coated |
–
|
0.00033
|
0.00042
|
Galvanized Iron |
0.00050
|
0.00033
|
0.00042
|
Cast Iron – Asphalt Dipped |
0.0004
|
–
|
–
|
Commercial Steel or Wrought Iron |
0.00015
|
–
|
–
|
Drawn Tubing |
0.000005
corresponds to “smooth pipe” |
–
|
–
|
Uncoated Steel |
–
|
0.00009
|
0.00013
|
Coated Steel |
–
|
0.00018
|
0.00018
|
Uncoated Asbestos – Cement |
–
|
||
Cement Mortar Relined Pipes (Tate Process) |
–
|
0.00167
|
0.00167
|
Smooth Pipes |
“smooth pipe”
|
“smooth pipe”
|
|
PE and other thermoplastics, |
–
|
( 0.000005 feet)
|
(0.000005)
|
Brass, Glass and Lead) |
(See Note)
|
(See Note)
|
|
Note: Pipes that have absolute roughness equal to or less than 0.000005 feet are considered to exhibit “smooth pipe” characteristics.
Relative roughness and friction factors for new, clean pipes for flow of 60°F (15.6°C) water (Hydraulic Institute Engineering Data Book, Reference 5) (1 meter 39.37 in = 3.28 ft).
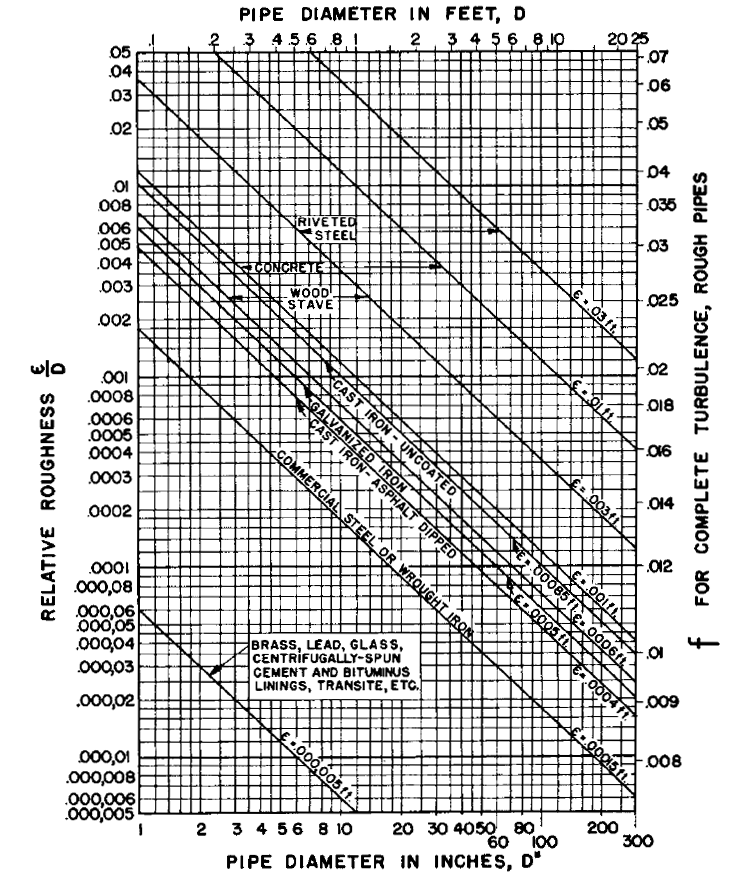
Figiure 1, Click on image to enlage
Where:
f = friction factor
D = Diameter (inches)
ε / D = Relative Roughness
ε = Measure of pipe wall roughness in feet (meters)
References:
1. Swierzawski, Tadeusz J. (2000). Flow of Fluids, Chapter B8, Piping Handbook, 7th edition, Mohinder L. Nayyar, McGraw-Hill, New York, NY.
2. Lamont, Peter A. (1981, May). Common Pipe Flow Formulas Compared with the Theory of Roughness, Journal of the American Water Works Association, Denver, CO.
Related Resources:
Link to this Webpage:
© Copyright 2000 -
2024, by Engineers Edge, LLC
www.engineersedge.com
All rights reserved
Disclaimer |
Feedback
Advertising
| Contact