Water Hammer (Waterhammer) Review and Equation
Fluid Flow Table of Contents
Hydraulic and Pneumatic Knowledge
Water Hammer Review
Related: Water Hammer Pressure Spike Equations and Calculator
Water hammer is a liquid shock wave resulting from the sudden starting or stopping of flow. It is affected by the initial system pressure, the density of the fluid, the speed of sound in the fluid, the elasticity of the fluid and pipe, the change in velocity of the fluid, the diameter and thickness of the pipe, and the valve operating time.
During the closing of a valve, kinetic energy of the moving fluid is converted into potential energy. Elasticity of the fluid and pipe wall produces a wave of positive pressure back toward the fluids source. When this wave reaches the source, the mass of fluid will be at rest, but under tremendous pressure. The compressed liquid and stretched pipe walls will now start to release the liquid in the pipe back to the source and return to the static pressure of the source. This release of energy will form another pressure wave back to the valve. When this shockwave reaches the valve, due to the momentum of the fluid, the pipe wall will begin to contract. This contraction is transmitted back to the source, which places the pressure in the piping below that of the static pressure of the source. These pressure waves will travel back and forth several times until the fluid friction dampens the alternating pressure waves to the static pressure of the source. Normally, the entire hammer process takes place in under one second.
The initial shock of suddenly stopped flow can induce transient pressure changes that exceed the static pressure. If the valve is closed slowly, the loss of kinetic energy is gradual. If it is closed quickly, the loss of kinetic energy is very rapid. A shock wave results because of this rapid loss of kinetic energy. The shock wave caused by water hammer can be of sufficient magnitude to cause physical damage to piping, equipment, and personnel. Water hammer in pipes has been known to pull pipe supports from their mounts, rupture piping, and cause pipe whip.
The pressure waves created by the hydraulic shock has characteristics similar to those of sound waves and travel at a similar velocity. The time required for a waterhammer pressure wave to negotiate a length of pipe is simply the pipe length divided by the speed of sound in water (approximately 4860 ft/sec). In waterhammer analysis, a time constant that is often used describes the progression of the wave from its inception to the secondary barrier and then back again. It takes the form of Tc = 2L/a (where “L” is the pipe length and “a” is the velocity of the wave (speed of sound)). For a 1000 foot length of pipe it would require less than one half second for the wave to make a complete round trip.
The pressure created by this shock wave is directly proportional to both the wave velocity and the velocity of the water flowing in the pipe. Although the equation below does not take into account the effect of pipe diameter and elasticity, it will provide some insight as to the additional pressure that is created by a waterhammer pressure wave.
P(additional) = aV / 2.31g
“P” is the additional pressure created by the shock wave, “a” is wave velocity, “V” is the velocity of the flowing water in the pipe in feet per second, “g” is the universal gravitational constant @ 32 ft/sec2 , and 2.31 is the pressure conversion constant. At a pipeline velocity of 5 ft/sec the additional pressure created by the shock wave is approximately 328 PSI. Increase that velocity to 10 ft/sec, and the additional pressure increases to about 657 PSI. Obviously, systems that are not designed to accommodate such an increased pressure are often damaged or even destroyed.
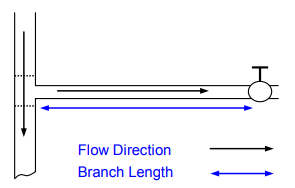
One of the primary causes of waterhammer is the abrupt closure of a valve. Figure 1 shows a main pipeline with a branch circuit that is fed by a “Tee”. At the end of the branch is a valve. The black arrows show the flow direction in the primary and branch lines and the blue arrow is the length of the branch line. As in last month's example, the valve acts as the primary barrier but this time the secondary barrier is the “Tee” itself. If water is flowing in the branch line and the valve is closed quickly, a shock wave will develop. Its inception follows the same sequence of events seen in our hypothetical example. One small difference is that some of the intensity of the waves will be lost in the “Tee” as it is open to the main pipe line on either side. Still, a significant portion will be reflected back towards the valve.
A major difference, in this example, is that we have some control over the valve closure time (in our hypothetical example the valves closed at nearly the speed of light). And, as you will see, closure time has a significant effect on the inception and intensity of waterhammer. In addition two other variables, flow velocity and pipeline length, are also major factors. The equation P = 0.07 (VL / t) shows the relationship of these three variables and their effect. “P” is the additional pressure generated by the shock wave, “V” is the flow velocity in ft/sec, “L” is the pipe length between the barriers in feet, and “t” is the valve closing time in seconds. 0.07 is the derived constant used to convert the combined variables into pressure. The additional pressure created by the shock wave is directly proportional to flow velocity and pipeline length and inversely proportional to closure time. In other words higher values of V and/or L will increase pressure while higher values of t will result in a decreased pressure. The table below shows the results we obtain from this equation when using differing velocities, pipe lengths, and closure times. For V the values are 5 & 10 ft/sec, for L they are 100 & 1000 ft, and for t we will use 1 & 2 seconds. In each example we will keep two of the variables constant.
| P = 0.07 (5x100) / 1 = 35 | P = 0.07 (5x100) / 2 = 17.5 |
| P = 0.07 (10x100) / 1 = 70 | P = 0.07 (10x100) / 2 = 35 |
| P = 0.07 (5x1000) / 1 = 350 | P = 0.07 (5x1000) / 2 = 175 |
| P = 0.07 (10x1000) / 1 = 700 | P = 0.07 (10x1000) / 2 = 350 |
Both columns of the table illustrate the proportional influence of velocity and length - - pressure increases as they increase. The lower values seen in the right hand column illustrate the inverse relationship of time - - these pressures are half those seen in the left hand column because the closure time has doubled. The value of L is often fixed and depends upon the application but, we can exercise substantial control over the other two variables. By doing so, we can eliminate or greatly reduce the effect of waterhammer.
Pipe diameter and the elasticity of its material also influence the pressure generated. Larger diameters and more elastic materials absorb some of the intensity of the shock waves and therefore reduce the pressure generated. Many pipe manufacturers publish curves or tables that show the potential waterhammer pressure increase for various pipe diameters and materials.
Contributed by:
Reyansh Argawal
Mumbai, India
Link to this Webpage:
© Copyright 2000 -
2024, by Engineers Edge, LLC
www.engineersedge.com
All rights reserved
Disclaimer |
Feedback
Advertising
| Contact